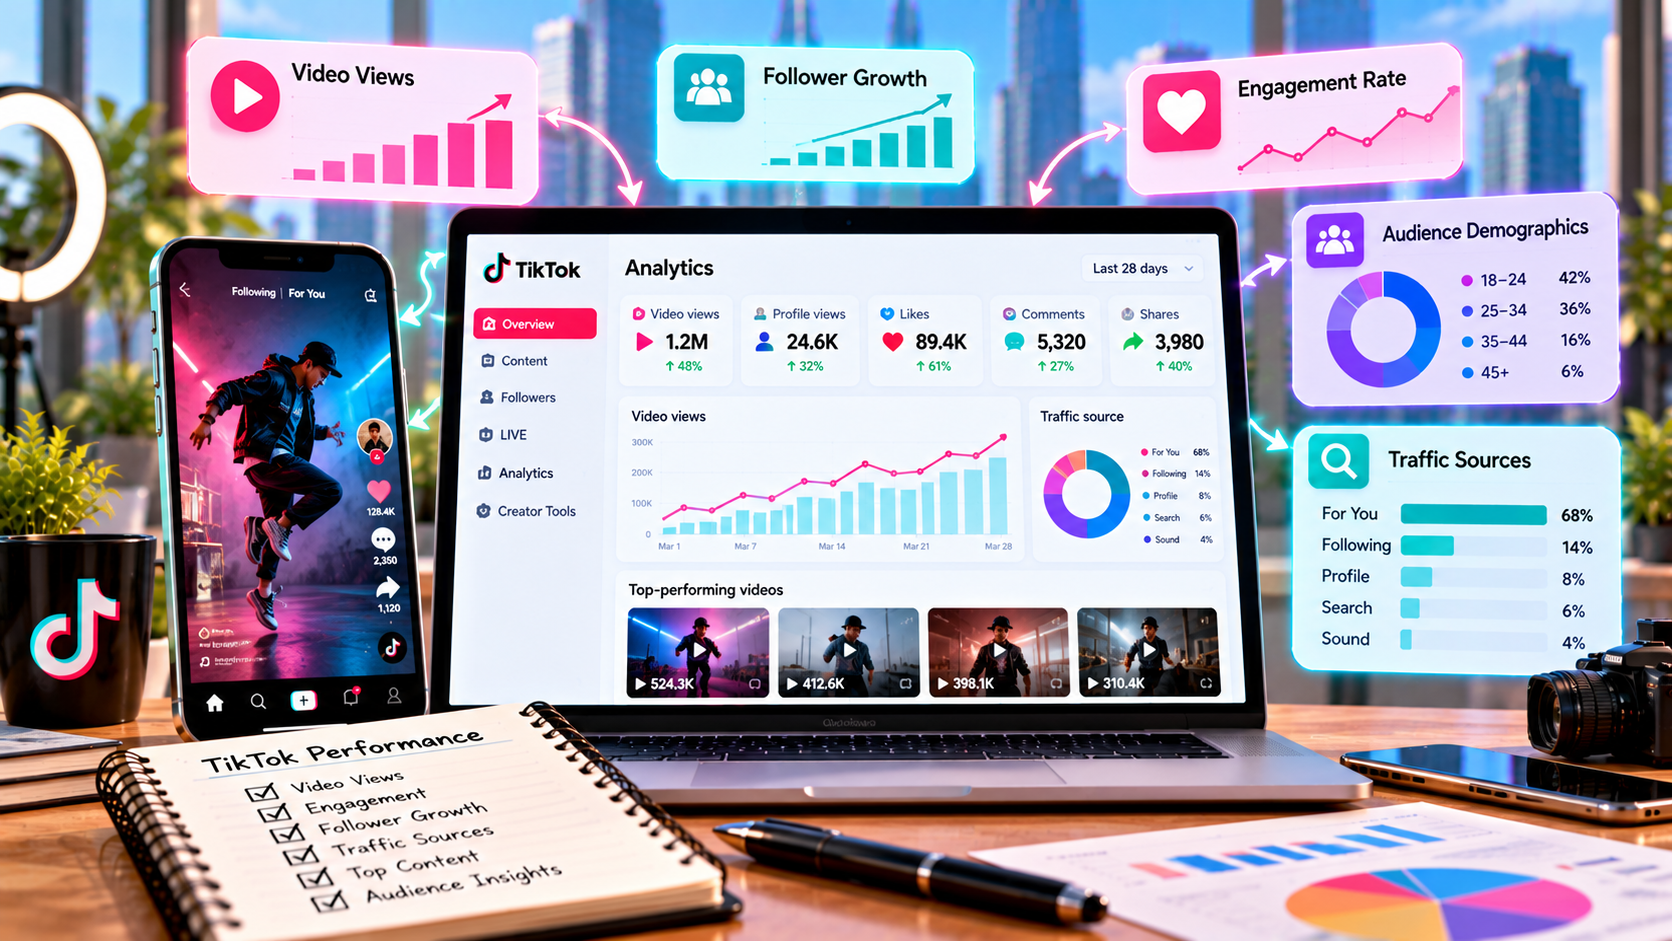
How to Analyze TikTok Performance: A Practical Guide
Creating TikTok videos is only one part of building an account. The other part is understanding what happens after a video is published.
Some videos receive thousands of views but generate very little interaction. Others may receive fewer views but bring more followers, shares, saves, or profile visits. Looking at these differences can help creators and businesses understand what their audience responds to and improve future content.
TikTok analytics provides useful information about video performance, audience activity, engagement, and account growth. However, the numbers become valuable only when they are interpreted together.
This guide explains how to analyze TikTok performance, which metrics to examine, how to compare videos, and how to turn analytics into practical content decisions.
What Is TikTok Performance Analysis?
TikTok performance analysis is the process of reviewing account and video data to understand how content is performing.
It can help answer questions such as:
Which videos attract the most viewers?
How long do people watch?
Which videos receive the most shares?
What content brings new followers?
Are viewers discovering content without already following the account?
Which topics consistently perform well?
Where are viewers losing interest?
What should be tested next?
The objective is not simply to find the video with the highest number of views.
The objective is to discover patterns that can guide future content.
Start With a Clear TikTok Goal
Before opening analytics, identify what the TikTok account is trying to achieve.
Different goals require different performance indicators.
GoalUseful Performance IndicatorsIncrease awarenessViews, reach, exposureImprove engagementLikes, comments, shares, savesBuild an audienceNew followers, profile visitsImprove video qualityWatch time, retention, completionGenerate trafficProfile visits, link activityGenerate business resultsLeads, sales, conversions
For example, a creator focused on educational content may care heavily about watch time, saves, and shares.
A business focused on customer acquisition may pay closer attention to profile visits, website activity, leads, and conversions.
The same analytics dashboard can therefore produce different conclusions depending on the objective.
Understand TikTok Analytics Before Interpreting It
TikTok's analytics interface and available reporting features can change as the platform updates its products and account features.
Depending on the account and current TikTok interface, analytics may provide information about areas such as:
Video views
Profile views
Likes
Comments
Shares
Followers
Watch time
Average watch time
Audience information
Traffic sources
Content performance
Rather than memorizing every dashboard label, focus on what each number is telling you about viewer behavior.
Video Views Show Exposure, Not Everything
Views are usually the first number people notice.
A video with 100,000 views clearly received substantial exposure. But views alone do not explain whether the audience was interested.
Consider two videos:
MetricVideo AVideo BViews100,00030,000Shares2001,200Comments150500New followers100850
Video A received more views, but Video B produced stronger audience actions.
This does not mean Video B is automatically "better." It means the two videos achieved different outcomes.
The important question is:
What did viewers do after watching?
Watch Time Is Critical for Video Content
TikTok is a short-form video platform, so understanding how viewers consume a video is particularly important.
Watch-related metrics can help answer:
Did people stay beyond the opening?
How long did they watch?
Did many viewers reach the end?
Did viewers replay the video?
Where might attention have dropped?
A video can receive a strong initial number of views but struggle to hold attention.
Another video may attract fewer initial viewers but maintain stronger viewing behavior.
This can provide clues about the difference between getting attention and keeping attention.
Average Watch Time Explained
Average watch time helps estimate how much of a video viewers watched on average.
Suppose a 20-second video has an average watch time of 14 seconds.
That means viewers watched approximately 70% of the video's duration on average:
14 ÷ 20 × 100 = 70%
This does not tell you everything about viewer behavior, but it gives useful context.
Compare that with another 20-second video averaging 7 seconds.
The second video may need a stronger opening, clearer structure, faster pacing, or more relevant content.
The exact interpretation depends on the content and audience.
Look for Early Drop-Off
One of the most useful questions in video analysis is:
Where are viewers losing interest?
If a large number of people leave shortly after the video begins, possible factors include:
A slow introduction
Unclear subject
Weak opening statement
Unnecessary context
Poor visual start
The video taking too long to reach the main point
This does not prove that one specific factor caused the drop-off.
Instead, it gives you a reason to test different openings.
For example, instead of starting with:
"Today we are going to talk about several ways businesses can improve their social media strategy..."
A creator might test a more direct opening:
"Your TikTok videos may be losing viewers in the first three seconds."
The goal is to reach the value of the video quickly.
Analyze Completion Behavior
Completion-related data can help determine whether viewers stay until the end.
This can be particularly useful for short videos.
For example:
Video A
Length: 15 seconds
Strong completion behavior
Video B
Length: 45 seconds
Much lower completion behavior
The lesson is not necessarily that all TikTok videos should be 15 seconds.
Instead, it may suggest that the account needs to test how video length affects viewer retention for its particular audience.
Different topics naturally require different amounts of time.
Shares Can Reveal Content Value
Shares are one of the useful signals to examine when analyzing TikTok content.
People may share videos because they are:
Useful
Entertaining
Relatable
Informative
Surprising
Relevant to someone they know
A video with moderate views and unusually high shares may contain an idea worth developing further.
For example, if a "3 mistakes beginners make" video generates significantly more shares than promotional videos, the creator could test additional educational content.
Comments Show Audience Response
Comments can reveal what viewers think, ask, disagree with, or want to learn next.
Do not only count comments.
Read them.
Look for recurring themes:
Frequently asked questions
Confusion about the topic
Positive reactions
Requests for another video
Common problems
Audience objections
Comments can therefore become a source of future content ideas.
A creator might turn one repeated question into an entire follow-up video.
Likes Provide a Quick Engagement Signal
Likes are useful, but they should be interpreted alongside other interactions.
A video can have many likes because viewers enjoyed it, but another video with fewer likes may generate significantly more shares, comments, or followers.
Instead of asking:
"Which video has the most likes?"
Ask:
"Which actions are most common among viewers of this type of content?"
This provides more useful information for content planning.
Profile Views Connect Content With Account Interest
Profile views can show whether video viewers became curious about the account.
For example:
Video A: 80,000 views → 400 profile views
Video B: 25,000 views → 900 profile views
Video A generated more exposure.
Video B generated more profile activity relative to its audience size.
That can be a valuable signal for creators or businesses that want to turn video discovery into audience growth.
Analyze New Follower Growth
Follower growth can help identify content that attracts people beyond a single viewing session.
When reviewing a strong follower-growth period, ask:
Which videos were published?
Which topic attracted new followers?
Did one video create a noticeable increase?
Was the content educational, entertaining, or promotional?
Did the profile clearly explain what the account offers?
This helps distinguish content that simply generates views from content that contributes to audience building.
Traffic Sources Can Explain Discovery
When available, TikTok traffic-source information can help explain how viewers discovered content.
For example, viewers may come from areas such as:
TikTok's recommendation surfaces
Search
Profile activity
Following-related surfaces
Other available discovery paths
The exact categories shown can vary.
If search-related discovery is significant, that may suggest that searchable topics and clear wording are contributing to content discovery.
If recommendation-based discovery dominates, the account may be receiving broader distribution beyond its existing audience.
Search Discovery Can Influence Content Strategy
TikTok has increasingly become a place where people search for information, recommendations, tutorials, and answers.
Creators can therefore examine whether their videos are being discovered through search-related behavior when such analytics are available.
For example, a marketing account might create videos around topics such as:
How to create a content calendar
How to calculate engagement rate
Instagram vs TikTok marketing
Social media content ideas
Instead of relying only on trends, searchable educational topics can create another path for discovery.
Compare Followers and Non-Followers
Understanding whether viewers already follow the account can provide useful context.
A video reaching mostly existing followers may be effective for community communication.
A video reaching a large number of non-followers may have stronger discovery potential.
Neither result is automatically preferable.
The interpretation depends on the objective.
For example:
Community goal → existing audience activity may matter more.
Audience growth goal → non-follower discovery becomes particularly useful to monitor.
Compare Similar Videos, Not Random Videos
A common analytics mistake is comparing completely different types of videos.
For example:
15-second comedy video
60-second tutorial
Product demonstration
Behind-the-scenes video
Each may serve a different purpose.
Instead, create groups.
Educational Videos
Compare educational videos against other educational videos.
Promotional Videos
Compare promotional videos against promotional videos.
Entertainment Videos
Compare entertainment videos against entertainment videos.
This makes patterns much easier to identify.
Create a TikTok Content Performance Table
A simple spreadsheet can reveal patterns that are difficult to notice inside the app.
VideoTopicLengthViewsAvg. Watch TimeSharesCommentsNew FollowersVideo ATutorial25 sec18K16 sec22085180Video BProduct Tip35 sec9K22 sec31070240Video CTrend12 sec40K8 sec903560
This table immediately shows that the highest-viewed video is not necessarily the one generating the most follower growth or meaningful interaction.
That is exactly why content should be evaluated from multiple angles.
Find Patterns Among Your Top Videos
Once you have several videos recorded, look for repeated characteristics.
Ask:
Are shorter videos performing better?
Do tutorials receive more saves?
Do opinion-based videos generate more comments?
Do certain topics produce more shares?
Do specific hooks generate longer watch time?
Do videos featuring a person perform differently?
Does educational content bring more followers?
Do product videos create more profile activity?
Do not assume that one successful video proves a permanent rule.
Look for the same pattern across multiple pieces of content.
Use Your Lowest-Performing Videos as Learning Data
Poor performance can still provide useful information.
Instead of deleting a weak video and forgetting about it, analyze it.
Ask:
Was the topic relevant?
Was the opening clear?
Was the video too long?
Was the pacing slow?
Did the visual quality affect understanding?
Was the CTA appropriate?
Did the video match the audience's interests?
One weak result does not prove that the entire content strategy is wrong.
It simply gives you another data point.
Analyze TikTok Performance by Content Pillar
If an account uses several content pillars, analytics can help compare them.
For example:
Content PillarAverage ViewsSharesNew FollowersTutorials15KHighHighIndustry News8KMediumMediumBehind the Scenes6KMediumLowPromotions3KLowLow
This could suggest that tutorial content deserves additional testing.
It does not mean every future video should become a tutorial.
A balanced content strategy may still need multiple content types.
Track Performance Over Time
A single video can be interesting.
A trend is more useful.
Track your performance weekly or monthly.
For example:
Month 1
Average views: 5,000
Average watch time: 9 seconds
Month 2
Average views: 7,500
Average watch time: 11 seconds
Month 3
Average views: 9,000
Average watch time: 13 seconds
This suggests that performance is changing over time.
Longer-term tracking can help determine whether content improvements are producing consistent results.
Don't Judge a Strategy From One Viral Video
A viral video can distort an account's average performance.
Suppose an account normally receives 5,000–15,000 views but one video reaches 1 million.
If that video is included in every average, normal performance can look artificially low.
For this reason, track:
Median performance when useful
Typical video performance
Performance by content type
Performance excluding exceptional outliers
The goal is to understand what the account can reproduce, not just what happened once.
TikTok Performance and Posting Frequency
Posting more videos creates more opportunities to test ideas, but quantity alone does not guarantee better performance.
If posting frequency increases while content quality declines, analytics may reveal weaker viewer response.
A better approach is to establish a sustainable publishing schedule and monitor:
Average views
Watch behavior
Engagement
Follower growth
Content quality
Audience response
Consistency makes testing easier because there is more comparable data over time.
How to Turn Analytics Into Better Content
Analytics only becomes useful when it changes future decisions.
For example:
Observation: Tutorial videos receive more saves.
Interpretation: The audience may value practical educational content.
Action: Create more tutorial-style videos.
Test: Publish several tutorials covering different topics.
Measure: Compare watch behavior, shares, saves, and follower growth.
This creates a continuous improvement process:
Data → Insight → Test → Result → Improvement
Common TikTok Analytics Mistakes
Focusing Only on Views
Views measure exposure but do not explain everything that happened afterward.
Ignoring Watch Time
A high-view video can still struggle to maintain attention.
Reading Numbers Without Reading Comments
Comments can explain why audiences react to content.
Comparing Different Content Types
Different formats and topics can have different performance patterns.
Copying a Viral Video Exactly
A viral result may depend on timing, topic, audience interest, and other factors that cannot simply be replicated.
Changing Strategy After One Bad Video
One weak result is not enough evidence to abandon a content direction.
Checking Analytics Without Taking Action
Data collection has limited value if nothing changes afterward.
Optimizing for One Metric
Improving views while ignoring follower growth, engagement, or business outcomes can produce an incomplete picture.
Can an SMM Panel Affect TikTok Analytics?
An SMM panel and TikTok Analytics have different purposes.
An SMM panel may offer services related to TikTok views, likes, followers, or other social media metrics. TikTok Analytics, meanwhile, provides information about how the account and its content are performing.
If an account uses any external social media service, its analytics should still be reviewed carefully.
Instead of looking only at a changed number, examine broader indicators such as:
Viewer behavior
Engagement
Profile activity
Follower growth
Content reach
Website activity
Actual business results
This helps keep analytics focused on overall performance rather than one isolated number.
A Simple Weekly TikTok Analytics Routine
A weekly review can be relatively simple.
Step 1: Record Your Top Videos
Identify the strongest videos from the week.
Step 2: Record Weak Videos
Keep them in the dataset instead of ignoring them.
Step 3: Compare Watch Behavior
Look for differences in retention and average watch time.
Step 4: Review Engagement
Check likes, comments, shares, and other available interactions.
Step 5: Check Profile and Follower Activity
Identify whether videos are generating deeper account interest.
Step 6: Read Comments
Look for questions and recurring audience interests.
Step 7: Plan the Next Tests
Choose two or three changes to experiment with.
This process takes analytics from simple reporting to practical content development.
Frequently Asked Questions
How do I know if a TikTok video performed well?
Look at the video in relation to its objective. Views, watch behavior, engagement, profile activity, and follower growth can all provide useful context.
Is watch time more important than views?
They measure different things. Views indicate exposure, while watch-time metrics help explain how viewers consumed the video. The appropriate focus depends on the goal.
Why did my TikTok get many views but few followers?
Viewers may have enjoyed the video without seeing a strong reason to follow the account. Check profile presentation, content consistency, topic relevance, and profile activity.
How often should TikTok analytics be reviewed?
A quick weekly review can help identify short-term patterns, while monthly analysis is useful for understanding broader trends.
Should every TikTok video be analyzed?
For small accounts, recording performance data for every video can be useful. As an account grows, creators may prioritize deeper analysis of representative, high-performing, low-performing, or strategically important videos.
Can TikTok analytics help find content ideas?
Yes. High-performing topics, recurring comments, shares, saves, and audience questions can all provide ideas for future content.
Why did one TikTok video perform much better than another?
Performance can be influenced by many factors, including topic relevance, audience interest, opening, watch behavior, content quality, timing, distribution, and competition. Analytics can provide clues, but one metric rarely explains the entire result.
Final Thoughts
TikTok Analytics is not simply a list of views, likes, and followers. It is a way to understand how people discover, watch, interact with, and respond to content.
The most useful analysis connects different pieces of information.
A video may attract attention through strong reach. Watch-time data can show whether viewers stayed interested. Shares and comments can reveal audience response. Profile activity and follower growth can show whether that attention developed into deeper interest.
The goal is not to chase a perfect number.
It is to identify repeatable patterns.
A practical TikTok growth process can be summarized as:
Create → Measure → Analyze → Test → Improve → Repeat
When creators and businesses consistently follow that process, TikTok analytics becomes much more than a reporting dashboard. It becomes a practical tool for making better content decisions.