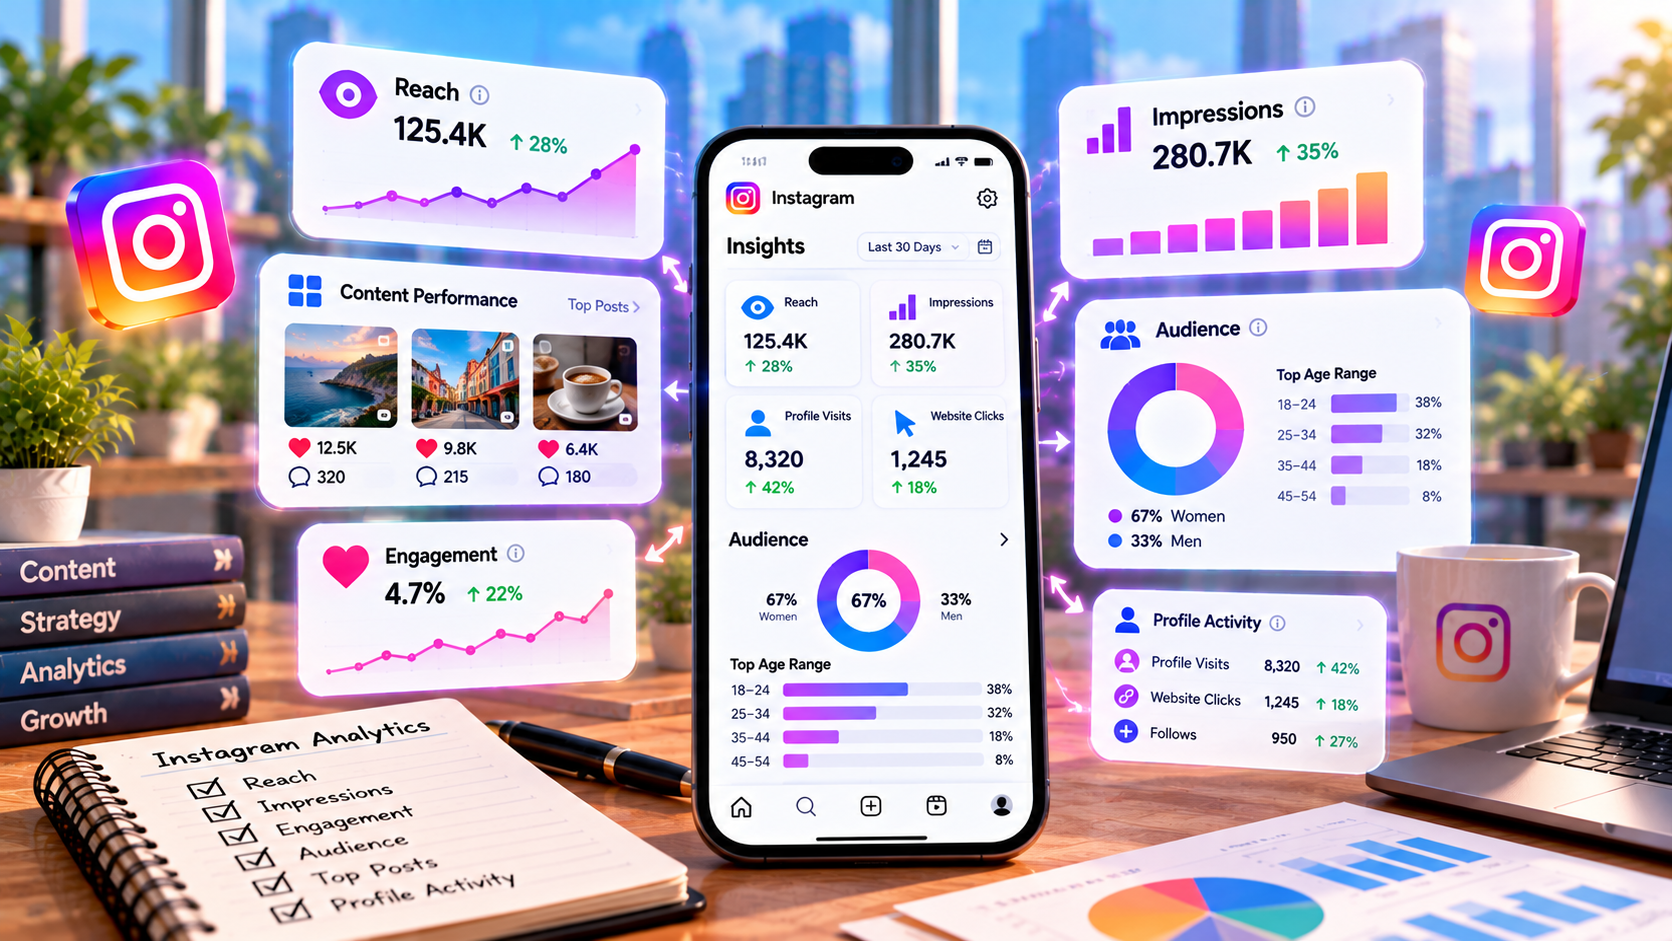
How to Read Instagram Analytics: A Practical Guide for Beginners
Instagram Analytics can tell a much bigger story than simply showing how many likes or followers an account has. When read correctly, analytics can help creators, businesses, marketers, and agencies understand what content is working, who is responding to it, and where future improvements may be needed.
Many Instagram users check their numbers without knowing what those numbers actually mean. A Reel may receive thousands of views but generate very few profile visits. Another post may reach fewer people but produce more saves, shares, or followers.
That is why Instagram Analytics should be viewed as a decision-making tool rather than just a collection of statistics.
This guide explains the main areas of Instagram Analytics, how to interpret them, how to compare content, and how to turn the data into practical actions.
What Is Instagram Analytics?
Instagram Analytics is the performance data available for an Instagram professional account. It provides information about account activity, content performance, audience behavior, reach, engagement, and other useful indicators.
Depending on the account type and Instagram's current features, the exact names and availability of analytics sections can change over time.
Instead of looking at every number separately, it is more useful to connect the numbers to specific questions:
Are more people discovering the account?
Which content attracts the most attention?
Are viewers interacting with the content?
Are non-followers discovering the account?
Which content brings profile visits?
Is the account gaining relevant followers?
What should be changed in the next content cycle?
Analytics becomes valuable when the answers lead to better decisions.
How to Access Instagram Analytics
Instagram provides professional accounts with access to performance insights through the account's professional dashboard and content insights.
The interface can change as Instagram updates its features, so users may see slightly different labels or sections depending on their account, location, device, and Instagram's current version.
When opening analytics, it is useful to select a specific time period before analyzing performance.
For example, a business might review:
The previous 7 days
The previous 30 days
The previous 90 days
A specific campaign period
The period before and after a content change
Comparing the same time periods makes the data more meaningful.
Understand the Main Instagram Analytics Areas
Instagram Analytics can be easier to understand when divided into several practical areas.
Analytics AreaWhat It Helps ExplainAccounts reachedHow many unique accounts saw contentAccounts engagedHow many accounts interacted with contentContent performanceWhich posts, Reels, or Stories performed wellFollowersAudience growth and follower-related informationProfile activityWhether people visited or interacted with the profileContent interactionsLikes, comments, shares, saves, and other actionsVideo performanceViews, watch behavior, and other video indicatorsAudience informationGeneral characteristics and activity patterns of followers
The goal is not to maximize every number at once. Each metric should be interpreted according to the purpose of the content.
Start With Reach: Are People Discovering the Content?
Reach is one of the first numbers worth checking.
Reach generally represents the number of unique accounts that were exposed to your content during the selected period.
For example, suppose an Instagram Reel reaches 20,000 accounts.
That tells you the content was distributed to a substantial audience, but it does not automatically mean that the Reel was successful in every other area.
The next questions should be:
How many people engaged?
How many watched the video?
How many visited the profile?
How many followed the account?
How many shared or saved the content?
Reach is therefore a starting point, not the final conclusion.
Check Followers vs Non-Followers
One particularly useful part of Instagram Analytics is understanding whether content is reaching existing followers, non-followers, or both.
This distinction can reveal whether an account is primarily serving its existing audience or attracting new people.
For example:
Post A
Strong follower reach
Low non-follower reach
Good comments from existing followers
Post B
Strong non-follower reach
More shares
More profile visits
New follower growth
These two posts serve different purposes.
Post A may be useful for community engagement, while Post B may have stronger discovery potential.
This is why simply comparing total reach can hide important differences.
Learn to Read Content Performance
Instagram content should not be analyzed as one large group.
Separate your performance by format:
Reels
Feed posts
Carousels
Stories
Other available formats
Then compare similar content against similar content.
For example, comparing a Reel with a Story using the same expectations may not provide much insight because they are designed and distributed differently.
Instead, compare:
Reel vs Reel
Carousel vs Carousel
Story vs Story
This makes patterns easier to identify.
How to Analyze Instagram Reels
For Reels, views are only one part of the picture.
A better analysis considers several signals together:
Views
Reach
Likes
Comments
Shares
Saves
Profile activity
Follows generated
Watch-time-related indicators when available
Imagine two Reels:
MetricReel AReel BViews25,00012,000Shares150480Saves90350Profile visits200700
Reel A generated more views, but Reel B generated stronger downstream actions.
That could suggest Reel B attracted viewers who had greater interest in the account's topic.
The lesson is simple: high views and high business value are not always the same thing.
Pay Attention to Watch Time
For video content, watch behavior can provide useful context.
If viewers leave very early, the opening may not be strong enough to hold attention.
If viewers continue watching for longer, the content may be doing a better job of maintaining interest.
When available, examine indicators related to:
Total watch time
Average watch time
Video retention
Completion behavior
Early drop-off
For short-form video, the first few seconds can have a major effect on whether someone continues watching.
A useful testing approach is to experiment with different:
Opening hooks
Video lengths
Editing styles
On-screen text
Story structures
Calls to action
Then compare the results rather than relying on assumptions.
Analyze Instagram Posts and Carousels
Feed posts and carousels can perform differently from Reels.
For these formats, pay attention to:
Reach
Likes
Comments
Shares
Saves
Profile visits
Follows
Engagement relative to reach
Saves can be particularly informative for educational, tutorial, checklist, or reference-style content.
Shares can indicate that people found the content useful or relevant enough to send to someone else.
A post with moderate reach but unusually high saves may deserve further attention.
Instead of asking only:
"Why didn't this post go viral?"
Ask:
"What did the people who saw this content find useful?"
That question can produce better content ideas.
Stories Need a Different Analysis
Instagram Stories are often more useful for understanding existing audience behavior than broad discovery.
Depending on the available analytics, review indicators such as:
Views or reach
Replies
Sticker interactions
Link activity
Profile actions
Story exits
Forward or backward navigation
Completion behavior
For example, if viewers consistently leave after a particular Story frame, the sequence may be too long or the content may lose relevance at that point.
On the other hand, a Story with strong replies or sticker interactions may show that the topic encourages participation.
Understand Engagement in Context
Engagement should not be viewed as a simple total.
Suppose one post receives:
1,000 likes
20 comments
30 shares
Another receives:
500 likes
80 comments
150 shares
The second post generated fewer likes but substantially more discussion and sharing.
Depending on the account's objective, that difference may be important.
A basic engagement-rate calculation can provide additional context:
Engagement Rate = Total Engagements ÷ Reach × 100
The calculation method should remain consistent when comparing content.
More importantly, ask which actions matter for the objective.
For example:
Brand awareness → reach and shares
Community building → comments and replies
Educational content → saves and shares
Traffic → link or profile actions
Account growth → profile visits and follows
Check Profile Activity
Profile activity can help connect content exposure with interest in the account.
Imagine a Reel reaches 50,000 people but generates only a small number of profile visits.
Another Reel reaches 15,000 people and generates significantly more profile visits.
The second Reel may be better at creating curiosity about the account.
When analyzing profile activity, look for connections between:
Content → Profile Visit → Follow → Further Action
This creates a more useful picture than viewing each metric independently.
Study Follower Growth
Follower growth is another important area of Instagram Analytics.
However, do not simply look at the current follower number.
Look at the change over time.
For example:
Starting followers: 5,000
Ending followers: 5,450
Net growth: 450
Then investigate what happened during that period.
Ask:
Which posts generated unusual reach?
Which Reels brought profile visits?
Was there a campaign?
Did a particular topic attract new users?
Did follower growth slow after posting frequency changed?
This connects follower growth to actual content activity.
Look at Audience Information
Audience analytics can help businesses understand who their existing followers are.
Depending on the information available to the account, this may include details such as:
Age ranges
Gender distribution
General locations
Follower activity patterns
Other audience characteristics
This information should be compared with the intended target audience.
For example, a business targeting university students in a particular market may discover that its actual audience is concentrated in a different age group.
That does not automatically mean the strategy is wrong. It means the business has useful information to investigate.
Use Audience Activity Data Carefully
Knowing when followers are active can help with scheduling decisions, but it should not become a rigid rule.
If analytics suggests that followers are more active during the evening, the account can test publishing around that period.
However, posting time is only one variable.
Content quality, topic relevance, format, audience demand, and distribution can all influence performance.
Instead of assuming a particular hour is always best, test a few reasonable publishing windows and compare results.
Compare Your Best and Worst Content
One of the easiest ways to learn from Instagram Analytics is to compare high-performing and low-performing content.
Create a simple table:
ContentReachEngagementSharesSavesProfile VisitsReel AHighMediumHighMediumHighReel BMediumHighLowHighMediumCarousel ALowMediumMediumHighLowReel CHighLowLowLowMedium
Then look for patterns.
Perhaps educational carousels generate saves while short Reels generate discovery.
Perhaps product demonstrations generate profile visits.
Perhaps opinion-based posts create comments but few new followers.
These patterns can influence the next content calendar.
Do Not Compare Every Post to a Viral Post
A common mistake is treating the best-performing post as the standard for every future post.
If one Reel reaches 500,000 accounts while normal content reaches 10,000, comparing every post directly against that viral Reel can make normal performance appear poor.
Instead, create realistic benchmarks.
For example:
Average Reel reach
Average carousel reach
Average engagement rate
Average profile visits
Average saves
Average shares
Average follower growth
Then compare new content against the account's own historical performance.
Use Time Periods Consistently
Analytics becomes more useful when comparisons use similar periods.
For example:
This month vs previous month
or
Last 30 days vs previous 30 days
You can also compare:
Before campaign vs during campaign
or
Before content strategy change vs after content strategy change
Avoid comparing one week of data against six months of data unless there is a specific reason.
Build a Simple Monthly Instagram Analytics Report
A small business does not need a complicated analytics system to start learning from Instagram.
A monthly report could include:
Account Growth
Starting followers
Ending followers
Net follower growth
Accounts reached
Accounts engaged
Content Performance
Top three Reels
Top three posts
Top-performing Story
Most-shared content
Most-saved content
Audience
Main audience locations
Relevant age groups
Follower activity patterns
Follower vs non-follower distribution
Business Actions
Profile visits
Website or link activity
Leads
Sales or other tracked conversions
Lessons
Write three simple conclusions:
What worked?
What underperformed?
What should be tested next month?
This turns analytics into an actionable report.
A Practical Instagram Analytics Workflow
A simple workflow can make monthly analysis much easier.
Step 1: Define the Objective
Decide what the account is trying to improve.
Examples:
Reach
Engagement
Community interaction
Website traffic
Leads
Sales
Follower growth
Step 2: Select Relevant Metrics
Do not track every available number.
Choose metrics that connect to the objective.
Step 3: Review Content by Format
Separate Reels, posts, carousels, and Stories.
Step 4: Identify Patterns
Look for repeated characteristics among high-performing content.
Step 5: Investigate Weak Content
Do not immediately delete or ignore low-performing posts.
Ask whether the problem was:
Topic
Hook
Format
Timing
Creative quality
Audience relevance
Call to action
Distribution
Step 6: Create New Tests
Use the findings to create controlled experiments.
For example:
Test a stronger opening
Try a different Reel length
Create more educational carousels
Change the CTA
Test a new content topic
Step 7: Measure Again
The process should continue:
Analyze → Learn → Test → Measure → Improve
Common Instagram Analytics Mistakes
Looking Only at Likes
Likes are useful, but they are only one type of interaction.
Focusing Only on Followers
Follower growth does not explain why people follow or whether they engage with the account.
Ignoring Non-Follower Reach
Non-follower exposure can provide important information about discovery.
Comparing Different Formats Directly
A Story, Reel, and carousel have different purposes and distribution patterns.
Judging Content Too Quickly
Some content may need time to accumulate meaningful performance data.
Changing Everything at Once
If an account changes the topic, format, posting frequency, design, and CTA simultaneously, it becomes difficult to understand what caused the change.
Ignoring Historical Data
An account's own performance history can be a useful benchmark.
Treating Analytics as a Scorecard
Analytics should answer business and content questions. It should not simply become a collection of numbers to check every day.
Can an SMM Panel Replace Instagram Analytics?
An SMM panel and Instagram Analytics serve different purposes.
Instagram Analytics helps users understand account and content performance.
An SMM panel, depending on the services offered, may provide social media marketing services such as views, likes, followers, or other forms of distribution support.
These services should not be treated as a replacement for analytics.
For example, if an account uses an external service to increase a content metric, the account owner should still examine broader indicators such as:
Reach
Engagement
Profile visits
Audience quality
Follower behavior
Website activity
Conversions
The important principle is to understand what happened rather than judging performance from one number.
A Simple Instagram Analytics Checklist
Before finishing a monthly review, ask:
Did reach increase or decrease?
Did non-followers discover more content?
Which format performed best?
Which topics attracted the most attention?
Which content generated the most shares?
Which content generated the most saves?
Which posts generated profile visits?
Did follower growth change?
Which content underperformed?
What pattern appeared among successful posts?
What should be tested next?
If these questions can be answered consistently, Instagram Analytics becomes much more useful.
Frequently Asked Questions
Is Instagram Analytics free?
Instagram provides analytics features to eligible professional accounts. Available features can vary as Instagram updates its products.
What is the most important Instagram metric?
There is no single metric that is most useful for every account. The appropriate metric depends on the account's objective.
Why is my Instagram reach high but follower growth low?
High reach means content was exposed to many accounts, but those viewers may not have found enough reason to visit the profile or follow it. Check profile visits, follows, content relevance, and calls to action.
Why do my Reels get views but few comments?
Views indicate exposure, while comments require an additional action. The content may attract passive viewing without encouraging discussion.
Should Instagram Analytics be checked every day?
Daily checks can be useful for monitoring unusual activity, but strategic decisions are usually easier to make by looking at trends over longer periods.
How often should an Instagram account review analytics?
A quick weekly review can identify short-term changes, while a deeper monthly review can reveal more reliable content and audience patterns.
Can analytics improve Instagram growth?
Analytics cannot guarantee growth, but it can help identify patterns, reduce guesswork, and guide future content decisions.
Final Thoughts
Instagram Analytics is most useful when it becomes part of the content strategy rather than a number-checking routine.
Reach can show whether content is being discovered. Engagement can reveal how people respond. Watch-time indicators can help evaluate video retention. Profile activity can show whether content creates additional interest, while follower and audience data can provide a broader picture of account development.
The strongest approach is to connect these signals.
Instead of asking, "Which post got the most likes?", ask:
"What did this data teach us, and how can that lesson improve the next piece of content?"
That shift turns Instagram Analytics from a reporting tool into a practical system for learning, testing, and improving social media performance.