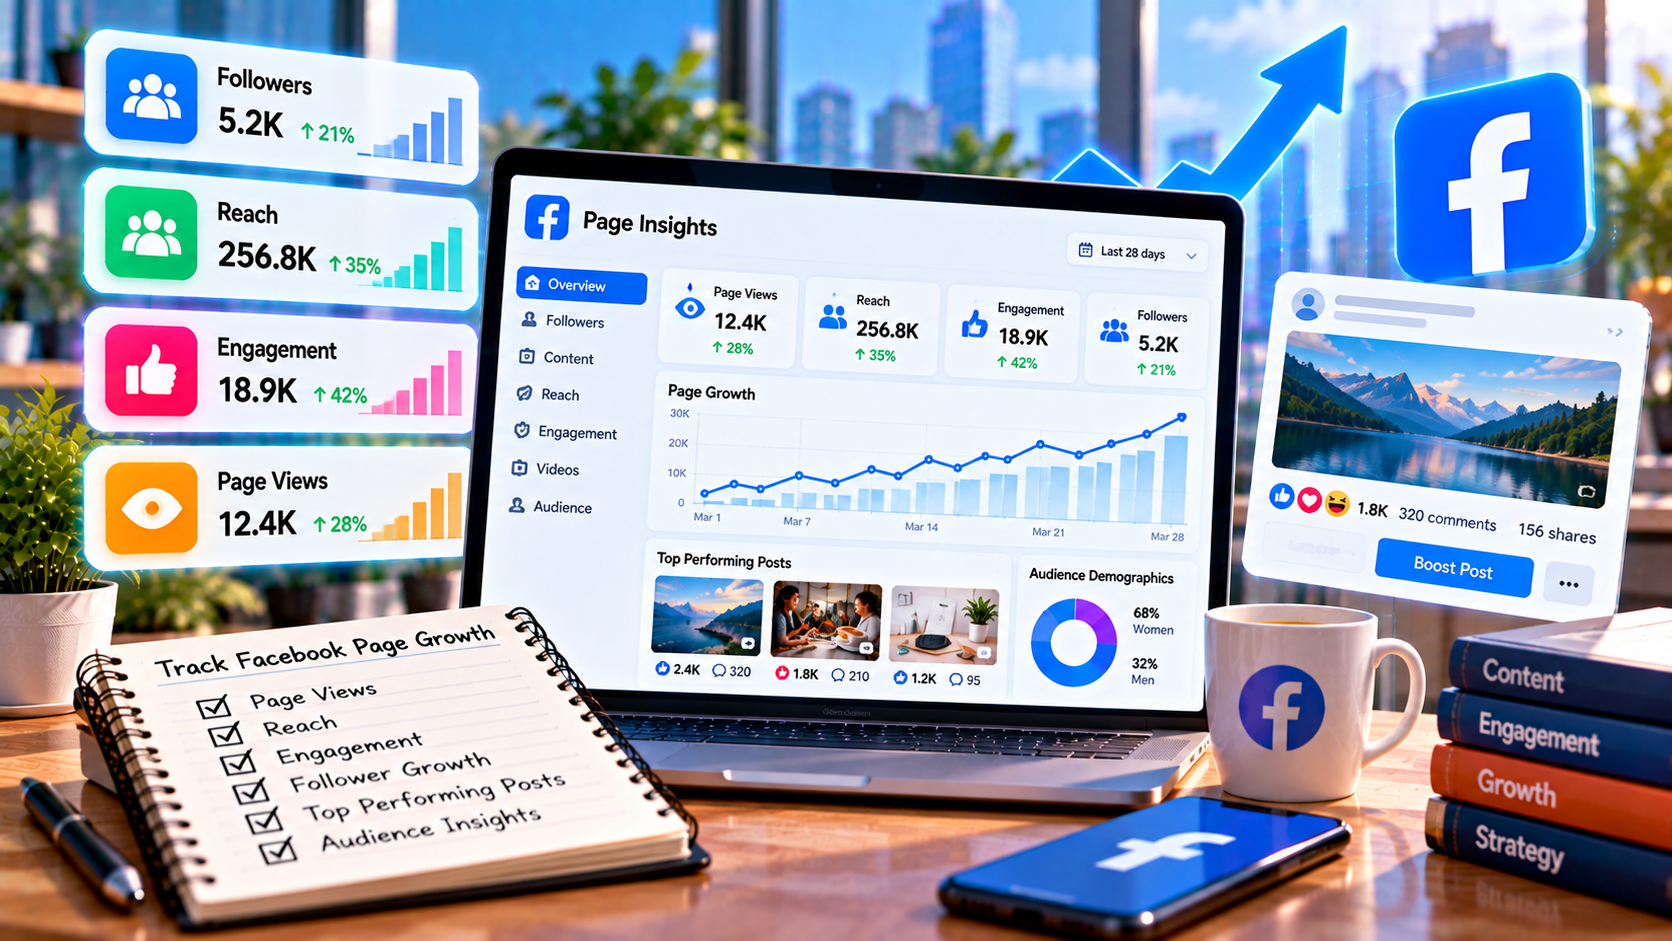
How to Track Facebook Page Growth: A Practical Guide 2026
Growing a Facebook Page is about more than watching the follower number increase.
A Page can gain followers without receiving meaningful engagement. Another Page may have a smaller audience but generate stronger reach, comments, shares, website visits, or customer inquiries.
That is why Facebook Page growth should be tracked from several angles.
A useful tracking system helps businesses and creators understand whether their audience is growing, whether content is reaching the right people, and whether that growth is contributing to their actual goals.
This guide explains how to track Facebook Page growth, which areas to monitor, how to compare content, and how to turn Page data into practical decisions.
What Does Facebook Page Growth Actually Mean?
Facebook Page growth refers to changes in the Page's audience, content reach, engagement, visibility, and other meaningful actions over time.
Follower growth is one part of the picture, but it is not the entire definition.
A growing Page may show improvements in:
Followers
Page reach
Content engagement
Video consumption
Shares
Comments
Page visits
Website activity
Messages
Leads
Conversions
The relevant measurements depend on what the Page is trying to accomplish.
For a local business, messages and leads may matter more than simply gaining followers.
For a media or creator Page, reach, shares, and video engagement may be especially useful.
Start With a Baseline
Before measuring growth, record the Page's current position.
For example:
MetricStarting PointFollowers8,000Monthly reach120,000Page visits4,500Content engagements6,000Website clicks700Leads90
This becomes the baseline.
After 30 days, the same metrics can be recorded again.
Without a baseline, it is difficult to know whether the Page is actually improving.
Track Follower Growth Over Time
Follower growth is one of the easiest Page metrics to understand.
Suppose a Page starts the month with 8,000 followers and ends with 8,600.
The net increase is:
8,600 − 8,000 = 600 followers
However, do not stop at the final number.
Ask what caused the increase.
Possible reasons include:
A high-performing post
A successful video
A promotional campaign
Increased organic reach
External promotion
A collaboration
Seasonal demand
Connecting follower growth to Page activity makes the data more useful.
Net Growth Is More Useful Than a Single Follower Number
A Page may gain new followers while also losing some existing followers.
For example:
New followers: 800
Unfollows: 250
Net growth: 550
Looking only at 800 new followers would give an incomplete picture.
Tracking both gains and losses can help identify changes in audience behavior.
If unfollows suddenly increase, investigate what happened around that period.
It could relate to:
Content changes
Posting frequency
Promotional activity
Audience expectations
Changes in Page positioning
The data does not automatically reveal the cause, but it tells you where to investigate.
Track Facebook Reach
Reach helps show how many people were exposed to Page content during a particular period.
Compare reach across consistent time periods.
For example:
January: 100,000 reached
February: 135,000 reached
March: 160,000 reached
This indicates that content exposure increased across the period.
But reach should still be connected to other outcomes.
A Page could increase reach without increasing engagement or business activity.
Therefore, ask:
What happened after people saw the content?
Separate Organic and Paid Performance
If a Page uses Facebook advertising, separate paid performance from organic performance whenever possible.
This distinction helps answer different questions.
Organic performance can show how content performs through unpaid distribution and audience activity.
Paid performance can show what happens when advertising budget is used to distribute content.
For example:
AreaOrganicPaidReachContent-driven exposureAdvertising-driven exposureCostNo direct ad spendRequires ad budgetMain useCommunity/content growthTargeted distributionAnalysisContent and audience responseCampaign efficiency and results
Combining both numbers without context can make Page performance difficult to interpret.
Track Content Performance
A Facebook Page should not be evaluated only at the account level.
Analyze individual content.
Group content into formats such as:
Text posts
Images
Carousels
Reels
Longer videos
Links
Stories
Then compare similar formats.
For example, if Reels consistently generate higher reach than image posts, that may be useful information for the content strategy.
However, format alone is rarely the complete explanation.
Topic, audience interest, creative quality, timing, and distribution can also affect results.
Identify Your Best Facebook Posts
Instead of simply recording the post with the most reactions, examine several outcomes.
A useful content report could look like this:
PostReachCommentsSharesLink ClicksPage VisitsPost A25K90350120400Post B18K150100300550Post C40K708090250
Post C achieved the highest reach.
Post B generated more link clicks and Page visits.
These posts performed differently.
The right interpretation depends on the objective.
Shares Can Be a Valuable Growth Signal
Shares can extend content beyond the Page's existing audience.
When someone shares a post, that content can potentially be seen by additional people connected to them.
A high number of shares may therefore indicate that content was useful, entertaining, relevant, or worth passing along.
Look for patterns among highly shared posts.
They might involve:
Practical tips
Educational information
Local information
Entertaining content
Community discussions
Helpful resources
Relatable experiences
Use these patterns as ideas for future testing rather than assuming the same result will happen every time.
Comments Can Help You Understand the Audience
Comments are not just an engagement number.
They can provide qualitative information.
Read the comments and look for:
Common questions
Customer concerns
Product requests
Frequently mentioned problems
Positive feedback
Confusion about an offer
Suggestions for future content
For businesses, this information can be useful beyond social media.
Repeated customer questions can become:
FAQ content
Educational posts
Short videos
Website articles
Product explanations
This turns Facebook activity into a source of audience research.
Track Page Visits
Page visits can help show whether content exposure is generating additional interest in the Page.
For example:
Month 1
Reach: 150,000
Page visits: 3,000
Month 2
Reach: 140,000
Page visits: 4,200
The second month had lower reach but higher Page visits.
That could indicate stronger interest among the people who encountered the content.
Again, the numbers should be interpreted alongside the Page's objectives and other available data.
Monitor Video Performance
For Pages that publish videos or Reels, video performance deserves separate attention.
Depending on the available Facebook analytics, examine indicators such as:
Views
Watch time
Average viewing behavior
Engagement
Shares
Comments
Follows or Page activity generated by videos
Do not judge video quality from views alone.
A video with fewer views but stronger watch behavior and Page visits may provide useful lessons.
Track Website Clicks and Traffic
For businesses using Facebook to drive website traffic, link activity should be tracked.
A simple workflow is:
Facebook Content → Click → Website Visit → Action
The final action might be:
Product purchase
Contact form submission
Booking
Newsletter signup
Account registration
Quote request
Website analytics can provide additional information that Facebook Page analytics alone cannot.
Where possible, use consistent campaign tracking parameters so traffic from Facebook can be identified more accurately.
Track Messages and Leads
For service businesses, Facebook messages can be more meaningful than follower growth.
Suppose a Page gains:
2,000 followers
but receives only:
10 customer inquiries.
Another Page gains:
500 followers
and receives:
75 relevant inquiries.
These Pages have different outcomes.
This does not mean follower growth has no value. It means businesses should connect social activity with the actual business objective.
Track:
Messages
Qualified inquiries
Leads
Bookings
Sales
Customer requests
when those actions are relevant.
Track Growth by Content Type
A useful monthly analysis can categorize content by purpose.
For example:
Content TypeReachEngagementSharesPage VisitsEducationalHighHighHighMediumPromotionalMediumLowLowHighEntertainmentHighHighMediumLowCommunityMediumHighMediumMedium
This can reveal that different content types perform different jobs.
Educational content might support discovery.
Promotional content might generate product interest.
Community content might encourage conversations.
A balanced content strategy can use these different roles rather than expecting every post to achieve the same result.
Compare New Content With Historical Performance
A Page's own history is often one of the most useful benchmarks.
For example, compare this month's average Reel performance with the previous three months.
You can track:
Average reach
Average engagement
Average shares
Average Page visits
Average video watch behavior
Average follower growth
This helps identify genuine changes rather than reacting to individual posts.
Avoid Comparing a Normal Post With a Viral Post
A viral post can distort averages.
Suppose most Page posts receive between 5,000 and 15,000 reach, but one post reaches 500,000.
If that post is treated as the normal benchmark, almost every future post will look weak.
Instead, identify typical performance.
You can use:
Median reach
Average performance by format
Average performance by content pillar
Performance ranges
This creates more realistic expectations.
Track Growth Month Over Month
A simple monthly dashboard can provide a useful overview.
MetricMonth 1Month 2Month 3Followers8,0008,6009,250Reach120K135K160KPage visits4.5K5.2K6.1KEngagements6K7.1K8.4KWebsite clicks7008201,050Leads90105130
The purpose of this table is not to create a universal target.
It is to identify the direction of the Page's performance and investigate what caused the changes.
Look for Relationships Between Metrics
The most useful insights often come from connecting metrics.
For example:
Reach ↑ + Page visits ↑ + Followers ↑
This may indicate that increased exposure is translating into greater Page interest.
Another example:
Reach ↑ + Engagement ↓
This may indicate that content is reaching more people without generating proportionally stronger interaction.
Another:
Followers ↑ + Leads unchanged
This may suggest that audience growth is not translating into the intended business outcome.
These patterns are starting points for investigation rather than automatic explanations.
Track Facebook Growth Against Your Goal
Different Pages need different measurement systems.
For a Local Business
Track:
Page reach
Local audience activity
Messages
Website visits
Calls or inquiries
Leads
Bookings
For an E-Commerce Business
Track:
Product-content reach
Link clicks
Product-page visits
Add-to-cart activity
Purchases
Revenue
For a Creator
Track:
Video views
Watch behavior
Shares
Comments
Page followers
Returning audience activity
For a Media Page
Track:
Reach
Shares
Comments
Video consumption
Returning audience activity
The tracking system should follow the purpose of the Page.
Create a Weekly Facebook Tracking Routine
A weekly review does not need to be complicated.
Step 1: Record Page Growth
Note follower changes and overall reach.
Step 2: Review Top Content
Identify the strongest posts and videos.
Step 3: Review Weak Content
Look for patterns in underperforming content.
Step 4: Read Comments
Find recurring audience questions and reactions.
Step 5: Check Business Actions
Review website clicks, messages, leads, or other relevant actions.
Step 6: Choose One or Two Tests
For the following week, test a specific improvement.
For example:
Stronger video openings
More educational posts
Different CTA
New content format
Different topic
Improved visual presentation
This makes the tracking process manageable.
Common Facebook Page Growth Tracking Mistakes
Looking Only at Followers
Follower count does not explain reach, engagement, or business results.
Ignoring Unfollows
Net audience change is more informative than new followers alone.
Mixing Organic and Paid Data
Paid and organic distribution answer different questions.
Judging Content Only by Reactions
Comments, shares, clicks, visits, and conversions may provide additional context.
Ignoring Content Type
Different formats can perform differently.
Comparing Against Other Pages
Competitor data can provide context, but your own historical performance is often a more consistent benchmark.
Changing the Strategy Too Quickly
A few poor-performing posts are not enough to determine that an entire strategy has failed.
Collecting Data Without Acting on It
Analytics should lead to testing and improvement.
Can an SMM Panel Be Used With Facebook Page Growth?
An SMM panel may offer Facebook-related services such as followers, likes, views, comments, or other forms of social media support.
However, these services should not replace Facebook Page analytics.
If an account uses external services, it is still important to monitor broader indicators such as:
Content reach
Audience engagement
Page visits
Follower behavior
Website activity
Leads
Sales
For SMMZY users, the dashboard can be used to track service orders, while Facebook's own analytics can be used to understand Page performance.
These are different layers of measurement and should not be treated as the same thing.
A Simple Facebook Growth Framework
A practical system can be summarized as:
Baseline → Publish → Measure → Compare → Learn → Test → Repeat
Baseline
Record the current Page performance.
Publish
Create and distribute content consistently.
Measure
Collect relevant Page and content data.
Compare
Compare similar content and consistent time periods.
Learn
Identify patterns and possible reasons for performance differences.
Test
Change one or two variables.
Repeat
Continue measuring the results.
This creates a more reliable process than making decisions based on individual posts.
Frequently Asked Questions
How do I know if my Facebook Page is growing?
Look at more than followers. Review follower changes, reach, engagement, Page visits, content performance, and relevant business actions over time.
How often should Facebook Page growth be tracked?
A weekly review can help identify short-term changes, while a monthly review is useful for evaluating broader trends.
Is follower count the best way to measure Facebook growth?
Follower count is one useful indicator, but it does not show the complete picture. Reach, engagement, Page activity, and business outcomes may also be important.
Why did my Facebook Page gain followers but engagement stay low?
New followers do not automatically guarantee interaction. Content relevance, audience quality, posting strategy, and the type of people discovering the Page can all influence engagement.
Should paid Facebook results be included in Page growth?
Paid and organic results can both be included, but they should be separated when analyzing performance so the source of growth remains clear.
What should I do if my Facebook reach suddenly drops?
First, compare the period with previous periods and examine individual content. Check whether posting frequency, content format, audience response, or other factors changed before making major strategic decisions.
Can Facebook analytics help improve content?
Yes. Performance data can reveal which topics, formats, and content styles are associated with stronger audience responses, helping guide future tests.
Final Thoughts
Tracking Facebook Page growth is not about checking one number every morning.
A useful tracking system looks at the complete journey:
Content → Reach → Engagement → Page Interest → Audience Growth → Business Action
Follower growth can show audience expansion. Reach can show content exposure. Engagement can reveal audience response. Page visits can indicate deeper interest, while website activity, leads, bookings, or sales can connect social media activity with business objectives.
The most useful approach is to establish a baseline, track consistent periods, compare similar content, identify patterns, and turn those findings into practical experiments.
When Facebook analytics becomes part of the regular content workflow, Page growth becomes easier to understand—and future decisions become less dependent on guesswork.