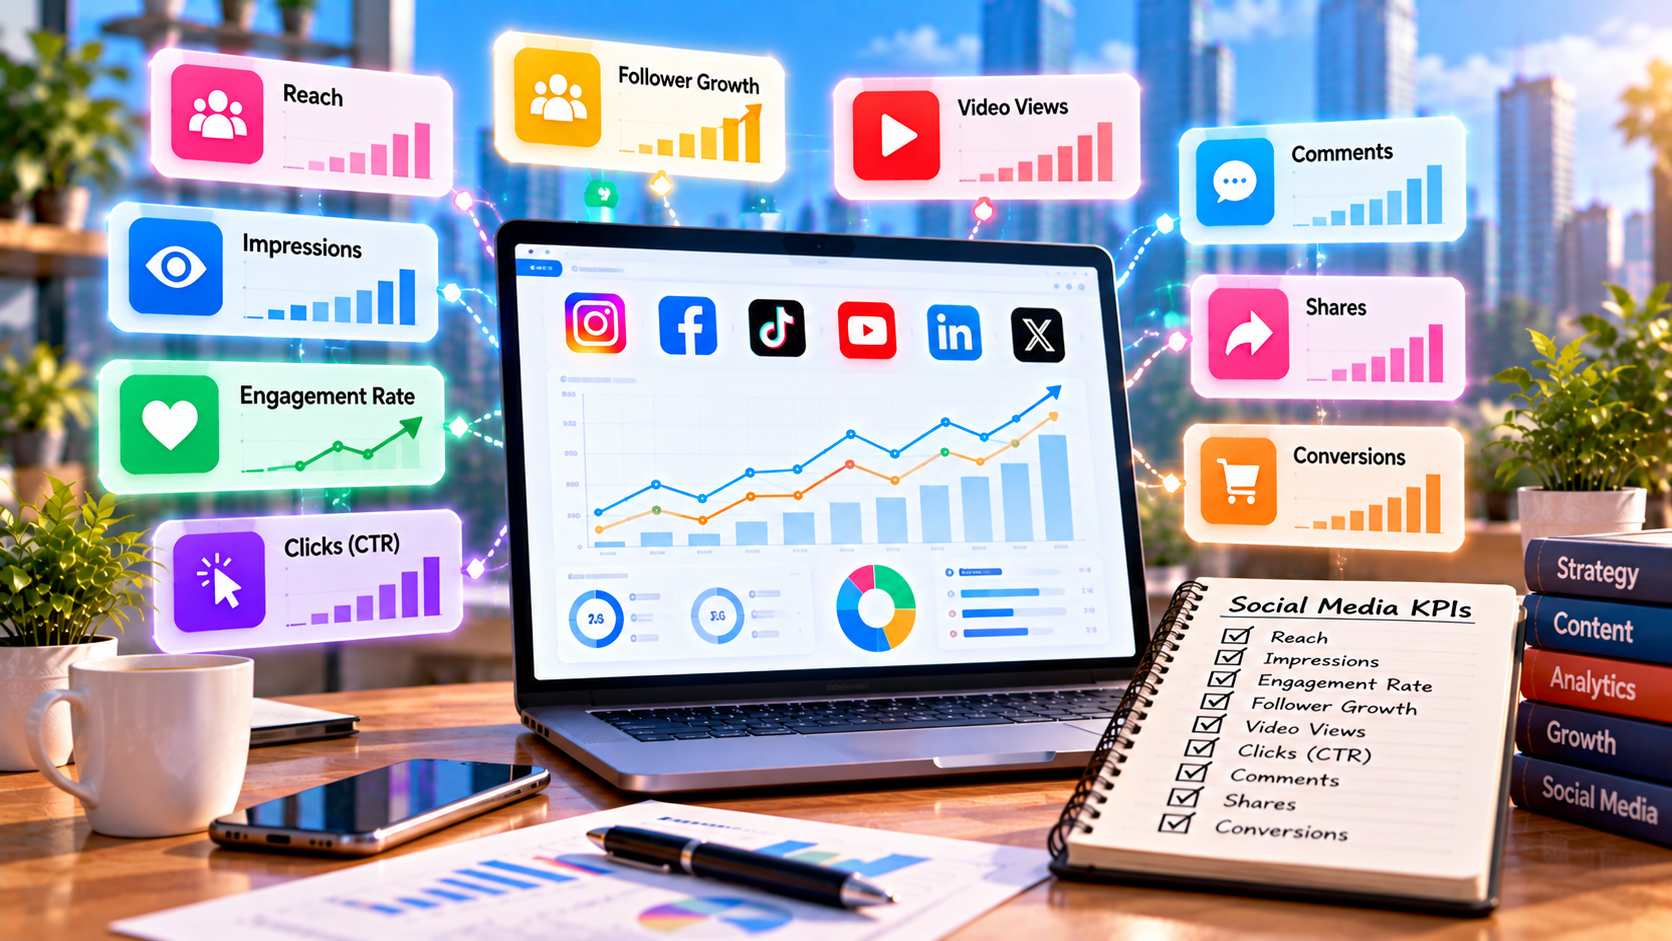
Social Media KPIs: A Practical Guide for Beginners
Social media platforms provide businesses with a huge amount of data.
A dashboard might show followers, likes, comments, reach, impressions, video views, clicks, profile visits, conversions, and many other numbers.
For someone new to social media marketing, this can quickly become confusing.
Which numbers actually matter?
The answer starts with Key Performance Indicators, commonly called KPIs.
Social media KPIs are specific measurements used to determine whether social media activities are helping a business achieve its goals.
Not every metric is a KPI for every business.
A local business may care about inquiries and bookings, while an online store may focus on purchases and revenue. A creator may be more interested in audience growth and content engagement.
This guide explains what social media KPIs are, how they differ from ordinary metrics, which KPIs beginners should understand, and how to build a simple KPI system.
What Is a Social Media KPI?
KPI stands for Key Performance Indicator.
A social media KPI is a measurable value selected because it helps evaluate progress toward a specific marketing or business objective.
For example, suppose a business wants to generate more customers from Instagram.
It might track:
- Website clicks
- Leads
- Conversion rate
- Purchases
- Revenue
Those measurements become more useful than simply tracking the number of likes because they are connected to the business objective.
A KPI should therefore answer an important question:
"How will we know whether we are making progress toward our goal?"
Metric vs KPI: What's the Difference?
A metric is a measurable piece of data.
A KPI is a metric that has been selected as an important indicator of progress toward a specific objective.
For example:
A business can measure:
- Likes
- Comments
- Followers
- Reach
- Impressions
- Clicks
- Leads
- Sales
All of these are metrics.
But if the business's main goal is generating leads, it might choose qualified leads as one of its primary KPIs.
The difference is mainly about purpose and priority.
MetricKPIAny measurable data pointImportant measurement tied to an objectiveCan be numerousUsually limited to key measurementsProvides informationHelps evaluate progressMay be useful for analysisUsed for decision-making and performance tracking
A KPI is not necessarily a special type of number.
It becomes a KPI because of how the business uses it.
Why Social Media KPIs Matter
Without clear KPIs, social media reporting can become a collection of unrelated numbers.
A report might say:
- 50,000 impressions
- 3,000 likes
- 500 comments
- 10,000 followers
But what do those numbers mean for the business?
KPIs provide direction.
They help businesses:
- Measure progress
- Identify successful campaigns
- Find weak areas
- Compare performance over time
- Allocate resources
- Improve content
- Understand audience behavior
- Connect social media with business goals
The purpose is not to track everything.
It is to track the right things.
Start With the Goal, Not the Metric
One of the biggest mistakes beginners make is choosing KPIs first.
A better process is:
Goal → KPI → Supporting Metrics → Analysis → Action
For example:
Goal: Generate more leads
Primary KPI: Qualified leads
Supporting metrics: Clicks, landing-page visits, conversion rate, cost per lead
This creates a logical measurement system.
Main Categories of Social Media KPIs
Social media KPIs can generally be grouped into several categories.
1. Awareness KPIs
These help measure how widely a brand or content is being exposed.
Examples include:
- Reach
- Impressions
- Brand mentions
- Video views
- Follower growth
2. Engagement KPIs
These help measure audience interaction.
Examples include:
- Engagement rate
- Likes or reactions
- Comments
- Shares
- Saves
- Replies
3. Traffic KPIs
These measure movement from social platforms to another destination.
Examples include:
- Link clicks
- Website sessions
- Profile link clicks
- Click-through rate
4. Conversion KPIs
These measure desired actions.
Examples include:
- Leads
- Purchases
- Sign-ups
- Bookings
- Downloads
- Registrations
5. Financial KPIs
These connect marketing activity with financial results.
Examples include:
- Revenue
- Customer acquisition cost
- Return on investment
- Return on ad spend
- Customer value
Different businesses will prioritize different categories.
Awareness KPIs
Awareness is often the first stage of the customer journey.
The goal is to put a brand or message in front of relevant people.
Reach
Reach generally represents the number of unique accounts exposed to content.
It is useful for understanding audience distribution.
Impressions
Impressions represent total content displays.
They can help show overall exposure and repeated visibility.
Follower Growth
Follower growth tracks how an account's audience changes over time.
A simple calculation is:
Follower Growth Rate = Net New Followers ÷ Starting Followers × 100
For example:
- Starting followers = 10,000
- Ending followers = 11,500
- Net new followers = 1,500
Growth rate:
1,500 ÷ 10,000 × 100 = 15%
Follower growth can be useful, but it should not automatically be treated as a business result.
Engagement KPIs
Engagement KPIs help show how audiences respond to content.
Engagement Rate
A common follower-based formula is:
Engagement Rate = Total Engagements ÷ Followers × 100
Other formulas may use reach, impressions, or views as the denominator.
When reporting engagement rate, always identify the calculation method.
Comments
Comments can provide useful qualitative information because they often contain questions, opinions, feedback, or discussions.
The number of comments alone does not tell you whether the comments are positive, negative, relevant, or useful.
Shares
Shares can help indicate that users found content useful, interesting, entertaining, or relevant enough to pass along.
Saves
Saves can be especially useful for educational, instructional, inspirational, or reference-based content.
Again, the importance of each engagement type depends on the content and objective.
Traffic KPIs
Social media traffic becomes important when the goal is moving users from a platform to a website, landing page, store, or other destination.
Link Clicks
Link clicks measure how many users clicked a tracked link or social media link.
Click-Through Rate
A common formula is:
CTR = Clicks ÷ Impressions × 100
For example:
- Impressions = 50,000
- Clicks = 1,000
CTR:
1,000 ÷ 50,000 × 100 = 2%
CTR can help evaluate how effectively content or advertising generates clicks relative to exposure.
Website Sessions From Social
Analytics systems can help identify visits originating from social media.
This provides additional context beyond platform-level clicks.
Conversion KPIs
Conversion KPIs become especially important when social media is expected to generate measurable actions.
A conversion might be:
- Purchase
- Lead
- Booking
- Registration
- Subscription
- Download
- Contact request
Conversion Rate
A basic formula is:
Conversion Rate = Conversions ÷ Relevant Visitors or Clicks × 100
Suppose:
- Social traffic = 2,000 visitors
- Purchases = 80
Conversion rate:
80 ÷ 2,000 × 100 = 4%
The exact denominator should match the conversion being measured.
Lead Generation KPIs
For service businesses, leads can be more important than direct online sales.
Useful KPIs can include:
- Total leads
- Qualified leads
- Cost per lead
- Lead-to-customer rate
- Revenue from leads
For example:
A campaign generates:
500 leads
but only:
75 qualified leads
The business may care more about qualified leads than total leads.
This is an important lesson:
More conversions do not always mean better results if the conversions are low quality.
Customer Acquisition Cost
Customer Acquisition Cost, or CAC, estimates how much a business spends to acquire each new customer.
A simple formula is:
CAC = Customer Acquisition Cost ÷ New Customers
Suppose:
- Acquisition cost = $4,000
- New customers = 100
CAC:
$4,000 ÷ 100 = $40
This can be useful when evaluating the efficiency of customer acquisition.
Financial KPIs
Financial KPIs connect social media marketing with money.
Revenue
Revenue shows how much money was generated from the measured activity.
ROAS
A basic advertising formula is:
ROAS = Attributed Revenue ÷ Advertising Spend
ROI
A basic ROI formula is:
ROI = (Return − Investment) ÷ Investment × 100
These metrics require reliable tracking and clearly defined attribution.
Vanity Metrics vs Meaningful KPIs
The term vanity metric is often used for numbers that look impressive but do not provide much useful information for a specific objective.
However, a metric is not inherently a vanity metric.
Its value depends on the context.
For example, follower count may be highly relevant when the goal is audience growth.
But follower count alone may provide limited information when the goal is generating sales.
The better question is:
"Does this number help us make a better decision?"
If the answer is yes, the metric may have a useful role.
Choosing KPIs for Different Business Goals
Different objectives require different KPIs.
Business GoalPrimary KPISupporting MetricsBuild awarenessReachImpressions, mentionsGrow audienceNet new followersReach, profile visitsImprove engagementEngagement rateComments, shares, savesIncrease website trafficQualified social trafficClicks, CTRGenerate leadsQualified leadsCPL, conversion rateIncrease salesRevenue or purchasesConversion rate, CACImprove advertising efficiencyROAS or ROICPC, CTR, conversion rateIncrease bookingsCompleted bookingsLeads, booking conversion rate
This approach prevents businesses from using the same KPI system for every campaign.
Primary vs Secondary KPIs
A useful KPI dashboard can separate measurements into two levels.
Primary KPI
The main indicator of success.
For example:
Qualified leads
Secondary KPIs
Measurements that help explain the primary result.
For example:
- Reach
- Clicks
- CTR
- Landing-page visits
- Conversion rate
- Cost per lead
This creates a clearer reporting structure.
Instead of tracking 20 numbers equally, the business knows which number matters most and which numbers help explain it.
Example: E-Commerce KPI System
Imagine an online clothing store wants to increase social media sales.
Its KPI structure could be:
Primary KPI:
Revenue from social media
Secondary KPIs:
- Purchases
- Conversion rate
- Website sessions
- Add-to-cart rate
- CTR
- CAC
- ROAS
Engagement can still be tracked, but it may not be the primary measure of commercial success.
Example: Local Service Business KPI System
A local service company may want more customer inquiries.
Its system could be:
Primary KPI:
Qualified inquiries
Secondary KPIs:
- Social traffic
- Contact form submissions
- Phone calls
- Messages
- Cost per lead
- Lead-to-customer rate
This is more useful than simply tracking follower growth.
Example: Content Creator KPI System
A creator may have a different objective.
For example:
Primary KPI:
Average content engagement rate
Secondary KPIs:
- Reach
- Average views
- Watch time
- Shares
- Saves
- Follower growth
A creator's goals may differ significantly from an e-commerce business.
That is why KPI selection should always begin with the objective.
KPI Example for a 30-Day Campaign
Suppose a business launches a social media campaign with the goal of generating leads.
After 30 days:
KPIResultReach80,000Impressions180,000Link Clicks4,000Leads300Qualified Leads120Customers25Revenue$7,500Marketing Cost$2,500
The primary KPI is qualified leads.
The other numbers provide context.
For example:
- High reach shows broad exposure.
- Clicks show traffic generation.
- Total leads show conversion volume.
- Qualified leads show lead quality.
- Customers show downstream results.
- Revenue shows financial impact.
This is a much stronger report than simply saying the campaign received 4,000 clicks.
Leading vs Lagging KPIs
Another useful distinction is between leading and lagging indicators.
Leading Indicators
These provide early signals.
Examples:
- Reach
- Engagement
- Clicks
- Video watch time
- Landing-page visits
Lagging Indicators
These represent later outcomes.
Examples:
- Customers
- Revenue
- Purchases
- Retention
- Profit
For example:
Social post → Click → Lead → Customer → Revenue
Clicks happen earlier.
Revenue happens later.
Both can be useful, but they serve different purposes.
How to Build a Simple KPI Dashboard
A beginner does not need a complicated analytics system.
Start with a small dashboard.
Monthly KPI Dashboard
CategoryKPICurrentPreviousChangeAudienceFollowers15,00013,500+11.1%AwarenessReach70,00062,000+12.9%EngagementEngagement Rate4.5%4.1%+0.4 ptsTrafficWebsite Clicks1,200950+26.3%ConversionLeads150110+36.4%FinancialRevenue$5,000$3,900+28.2%
This dashboard is easy to understand and provides enough information to identify major changes.
How Often Should KPIs Be Checked?
Not every KPI needs to be reviewed at the same frequency.
Daily
Useful for:
- Active campaigns
- Major ad problems
- Sudden performance changes
Weekly
Useful for:
- Content performance
- Audience growth
- Engagement trends
- Campaign optimization
Monthly
Useful for:
- KPI reporting
- Strategic analysis
- Comparing performance
- Setting new targets
Quarterly
Useful for:
- Larger strategy reviews
- Budget planning
- Channel evaluation
- Long-term trends
Checking every number every day can create unnecessary noise.
How to Set KPI Targets
A KPI becomes more useful when it has a target.
Instead of:
"Increase website traffic."
use:
"Generate 5,000 qualified social visits this quarter."
A good target should consider:
- Previous performance
- Available resources
- Audience size
- Campaign budget
- Business objectives
- Historical trends
Avoid choosing targets simply because they sound impressive.
Common Social Media KPI Mistakes
1. Tracking Too Many KPIs
If everything is a KPI, nothing is truly a priority.
2. Choosing KPIs Before Goals
Start with the objective.
Then choose measurements.
3. Using Followers as the Only KPI
Audience size does not explain engagement, traffic, or revenue.
4. Ignoring Metric Definitions
Different platforms may calculate similar metrics differently.
5. Comparing Different Time Periods Without Context
Seasonality, campaigns, holidays, and other factors can influence performance.
6. Focusing Only on Positive Numbers
A strong report should identify weaknesses as well as successes.
7. Changing KPIs Too Frequently
Consistent measurement makes trends easier to understand.
8. Ignoring Business Outcomes
Social media metrics should eventually connect with the organization's broader goals.
How SMM Panels Fit Into KPI Tracking
SMM panels may provide services related to followers, likes, views, comments, and other social media activities.
These activities can affect visible account numbers, but they should not automatically be treated as business KPIs.
For example, follower count may increase after a service, but businesses should still monitor:
- Reach
- Engagement
- Website traffic
- Leads
- Customers
- Revenue
The most useful KPI system measures whether social media activity is contributing to the actual objective.
A Simple KPI Framework for Beginners
Use this process:
1. Define the Goal
What does the business want to achieve?
2. Choose One Primary KPI
Which number best represents success?
3. Add Supporting KPIs
Which numbers help explain the primary result?
4. Set a Target
What result is the business aiming for?
5. Track Consistently
Use the same definitions and reporting periods.
6. Review the Data
Identify what changed.
7. Take Action
Adjust content, campaigns, targeting, or other relevant activities.
8. Repeat
KPI tracking should become part of an ongoing improvement cycle.
Frequently Asked Questions
What does KPI mean in social media marketing?
KPI stands for Key Performance Indicator. It is a measurable value selected to evaluate progress toward an important social media or business objective.
What is the difference between a metric and a KPI?
A metric is any measurable data point. A KPI is a metric selected because it is particularly important for measuring progress toward a specific objective.
What are the most important social media KPIs?
There is no universal list. Common KPIs include reach, engagement rate, follower growth, clicks, leads, conversions, revenue, CAC, ROI, and ROAS, depending on the goal.
Is follower count a KPI?
It can be. If audience growth is an important objective, follower growth can be a relevant KPI. It should not automatically be treated as the main KPI for every business.
How many KPIs should a business track?
There is no fixed number, but keeping a small group of primary and supporting KPIs usually makes reporting easier to understand and act on.
What KPI should an e-commerce business track?
An e-commerce business may prioritize purchases, social-attributed revenue, conversion rate, CAC, or ROAS, depending on its campaign objectives.
What KPI should a service business track?
Service businesses often focus on qualified leads, inquiries, bookings, conversion rate, cost per lead, and eventually customer revenue.
How often should social media KPIs be reported?
Weekly reporting can help with active campaigns, while monthly and quarterly reports are useful for broader performance analysis.
Can likes and comments be KPIs?
Yes, if engagement is a meaningful objective. However, they may be supporting metrics rather than primary KPIs when the ultimate goal is leads, sales, or revenue.
Why do social media KPIs change between businesses?
Different businesses have different objectives, audiences, sales cycles, and business models. A KPI that matters to an e-commerce store may be less relevant to a content creator or service company.
Final Thoughts
Social media provides more data than most businesses can realistically use.
The goal of KPI tracking is not to monitor every available number.
It is to identify the measurements that actually help answer:
"Are our social media activities moving us toward our goal?"
A simple approach is:
Goal → Primary KPI → Supporting Metrics → Target → Review → Action
Follower growth can matter.
Reach can matter.
Engagement can matter.
Clicks, leads, customers, and revenue can matter.
But their importance depends on the objective.
When businesses select KPIs based on their actual goals and track them consistently, social media analytics becomes much easier to understand—and much more useful for making better marketing decisions.